
Nobody tells you this when you register for the GMAT — your score and your percentile are two completely different things, and mixing them up is one of the most expensive mistakes you can make during MBA prep.
Not expensive in money. Expensive in time. Months of it, sometimes, chasing a number that sounds impressive but doesn’t actually mean what you think it means.
So let’s get into it.
The Name Situation First
Small but important: if you’ve been searching for “GMAT Focus Edition” and getting confused by inconsistent results, here’s why. GMAC quietly dropped that label in July 2024. The test is just called the GMAT exam now. What came before it got renamed the GMAT 10th Edition.
The scoring system changed when the new version launched, and that’s the part that’s causing most of the confusion around benchmarks and targets. More on that in a minute.
What the Exam Is Actually Testing
Three sections make up the current GMAT. Each one is scored from 60 to 90, and they all pull equal weight:
Quantitative Reasoning. Math logic, data interpretation, word problems. Geometry got cut from this version — which genuinely surprised a lot of test-takers who’d been grinding triangle theorems.
Verbal Reasoning. Reading comprehension and argument-based questions. Sentence correction is also gone. What replaced it is arguably harder because you can’t game it with grammar rules anymore.
Data Insights. The section that trips people up the most. Multi-source data, graphical interpretation, two-part analysis. It’s designed to simulate how decisions actually get made in business contexts, which sounds fine until you’re 90 minutes into the exam.
Total score: 205 to 805, jumping in increments of 10.
The Actual Difference Between a Score and a Percentile
Two people both ran a 4:30 mile. One was on a Tuesday morning jog in the park. The other was at a college track meet with scouts in the stands. At the same time. Completely different story.
Your GMAT score is the time. The percentile is the context.
Your score — somewhere between 205 and 805 — doesn’t know anything about the context around it. It doesn’t know who you were compared to that day, whether the testing cycle was heavy or light, or how many times someone else might have taken it before you. It just exists as a number.
Percentiles come from a large group of real test-takers on the same version of the exam. What they really show is simple: how many people you did better than in that pool.
Admissions readers aren’t measuring you against the scale. They’re measuring you against the pile of other applications on their desk — people who tested on different days, different versions, different continents. The percentile is the only number that lets them do that cleanly. The raw score leaves too many variables in the room.
The 700 Problem
For years, 700 was the number. Not a strong score — the score. It spread through forums, MBA blogs, and advice from people who tested half a decade ago. Get above it or start explaining yourself.
The exam changed. The advice didn’t.
A 700 on the current GMAT is a very high score (around the 98th percentile). It places you in a small top segment of test-takers globally. Whether most admitted students at Harvard and Wharton score above it varies by class, but many admitted candidates do fall around or above this range. Chasing it as a baseline isn’t ambitious — it’s just often misunderstood.
645 is around the upper-80s percentile (varies slightly by GMAC updates). It’s a strong score, but it is not a direct replacement for “what 700 used to mean,” because the old and new scoring systems are not directly comparable. The distribution has shifted, and so has the meaning of specific numbers.
Students are out there grinding toward a number that got redefined with the new exam structure, feeling behind on scores that are actually competitive. That’s not a preparation problem. It’s a bad information problem, and it’s costing people months.
Reading the Score Ranges Honestly
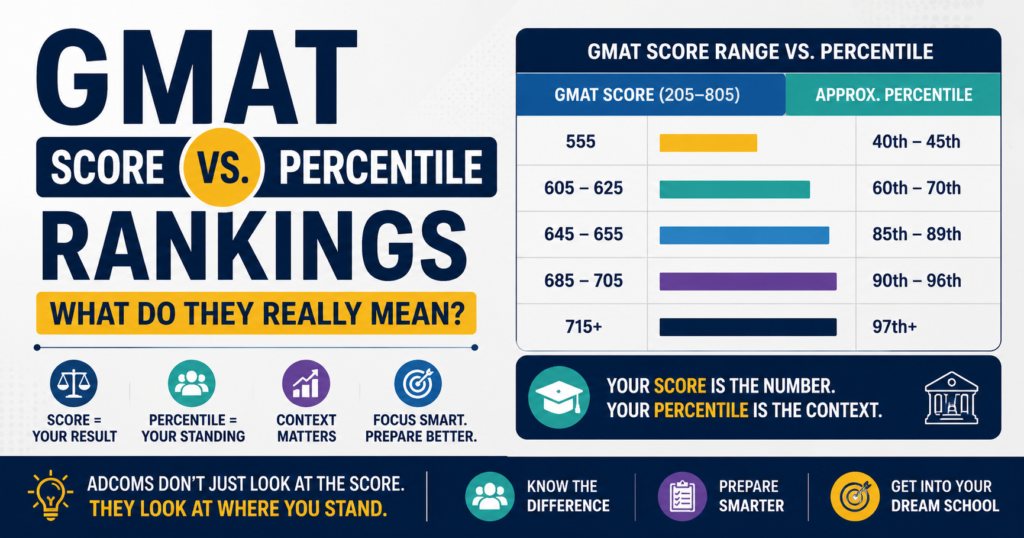
Here’s how the current scale actually breaks down in plain terms:
A 555 puts you around the middle of the distribution (above the mean, give or take, depending on the testing pool). You’ve beaten roughly 40–45% of test-takers. For programs outside the top tier, that can be workable with a strong application. For more competitive schools, it usually needs to go up.
The 605 to 625 band is where you’re clearly above average. You’re not in the elite range yet, but you’ve separated yourself from the bulk of test-takers. Getting here is progress. Stopping here is a choice you’d want to make intentionally.
645 to 655 is where serious applicants to top programs often land. This is a strong competitive range — typically high-80s percentile territory. You’ve outperformed most test-takers, which matters, but it’s still not the ceiling.
685 to 705 puts you in the high-90s percentile range. This is where admitted classes at schools like Booth, Wharton, Columbia, and MIT Sloan often include many candidates. A score in this range doesn’t guarantee anything, but it stops being a liability.Above 715 and you’re in the extreme upper end of the distribution. Rare. Impressive. Still not a substitute for a strong overall application — which is its own lesson.
Why Quant Gets Its Own Attention
The total score matters. The section breakdown matters too, and a lot of applicants don’t realize this until late.
Specifically, admissions committees look hard at the quant percentile for anyone whose background doesn’t scream “math person.” If you majored in English, built a career in nonprofit fundraising, or spent a decade in journalism, a strong quant section is one of the few ways to preemptively answer the question the adcom is going to ask anyway. Can this person handle the quantitative load of a first-year MBA?
There’s a real case worth knowing about. A candidate had two scores to choose from: a 700 total with a 52nd percentile quant, or a 690 total with a 71st percentile quant. The admissions consultant recommended submitting the 690. The lower headline number, stronger section signal. Schools that care about quant rigor — and most top programs do — found the 690 more reassuring.
That’s the kind of nuance that gets missed when people only track their total score.
Harvard’s GMAT — The Real Answer
HBS doesn’t publish a cutoff. Never has. What the admitted class data usually suggests is that many successful applicants land somewhere in the very high percentile ranges on the current GMAT scale — often in the upper 600s and above in raw score terms.
That’s the real range. Not a magic number, a range.
Mid-600s admits exist. Not common, not easy to pull off, but they happen — usually when the rest of the file is doing something the score can’t. A career trajectory that’s hard to ignore. A background nobody else in the room has. Work that speaks louder than a test result.
The score matters at Harvard. It just doesn’t work like a gate. Treating it as one makes prep more stressful and less useful than it needs to be — and stress doesn’t move percentiles.
Is There a Passing Score?
No. Not officially, anyway.
The GMAT isn’t a pass/fail exam. There’s no number below which your score is invalid. Every score is real, reportable, and on record.
Practically, “good enough” is school-specific. A score that works beautifully for one program might look thin in another. The 60th percentile clears the bar at some programs. The 90th percentile is where you want to be compared to others. It depends entirely on where you’re applying and what the rest of your application looks like.
The more useful question isn’t “did I pass?” It’s “Is this score helping me or hurting me at the schools on my list?” That’s the one worth answering honestly.
Where The Princeton Review Fits In
There’s a difference between knowing how GMAT scoring works and actually improving your score. The first takes a conversation. The second takes a plan.
The Princeton Review Singapore has built its GMAT prep around a specific conviction: that how you practice is more important than how much you practice. The DrillSmart engine behind their courses does something static prep books can’t — it adjusts in real time based on your performance, targeting whatever’s costing you the most points rather than covering the whole curriculum at the same pace.
Their 645+ course targets people applying to top-25 programs. Live instruction, an adaptive study plan, and structured preparation designed around score improvement. Unlike a lot of prep companies that mainly sell motivation, the focus here is on accountability and measurable progress.
What The Princeton Review does well, specifically, is keeping you from the most common prep mistake: spending equal time on everything. The adaptive platform tells you where your time is going to pay off. That’s not a small thing when you’re working around a job or other commitments.
What to Take Away From All of This
Two numbers on one score report, and most people only pay attention to one of them. That’s usually where the problem starts.
Your score means something. Your percentile means something different — and in an admissions office sorting through thousands of files, the percentile is the one that travels. It holds up across exam versions, testing years, and international applicants in a way a raw number simply doesn’t.
So stop comparing your score to the school’s average score. Find their median, convert it to a percentile using GMAC’s chart, then look at where your percentile sits against that. That gap — not the number gap, the percentile gap — is what you’re actually trying to close.
A 30-point raw score difference can mean almost nothing. A 15-percentile gap can mean everything. Those are not the same unit of measurement, and treating them like they are is how people spend three months preparing for the wrong thing.
Do the percentile math first. Then build the plan.